

Weekly Displacement Grids
Download from SOPAC: Weekly displacement grids and misfits (Username: anonymous; Password: your email address)
Download from CDDIS: Weekly displacement grids and misfits (Register for NASA Earthdata login)
View: Video prepared by Katherine Guns
Overview
The daily displacement time series corrected for outliers and artifacts (non-coseismic offsets) provide a record of crustal motions that represent secular, long-term processes such as interseismic deformation (station velocities), as well as horizontal and vertical transient motions. The transients may include coseismic and postseismic motions from earthquakes, magmatic inflation and deflation (e.g., at Long Valley Caldera - Liu et al., 2011), subsidence (e.g., in California’s San Joaquin Valley - Argus et al., 2017), and episodic tremor and slip (ETS) (e.g., in Cascadia - Rogers and Dragert, 2003). The detection of transients is important in fault slip modeling and assessing seismic risk. However, transients other than coseismic, and postseismic motions and secular subsidence rates are not modeled as part of our time series analysis. Therefore, to highlight transient motions, we create horizontal and vertical weekly displacement grids from the median-filtered daily time series (Klein et al., 2019), as well as corresponding strain rate grids. Currently, our displacement grids are limited to the Western U.S. and British Columbia (Vancouver Island).
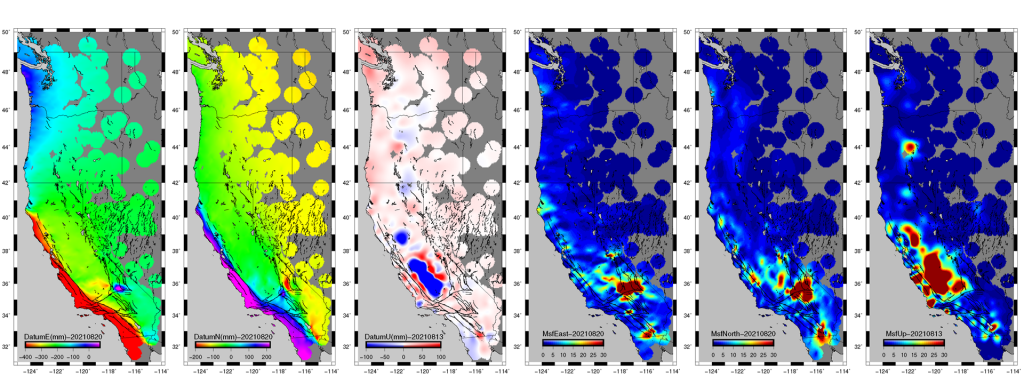
There are several types of grids & vector plots that are detailed in our Algorithm Theoretical Basis Document (ATBD) - Table 3, Section 5.5. They include, in horizontal and vertical components,
Table3_Totaldisplacements (pdf)
![]()
Table3_Horizontal transients (pdf)
![]()
![]()
References:
Argus, D.F., Landerer, F.W., Wiese, D.N., Martens, H.R., Fu, Y., Famiglietti, J.S., Thomas, B.F., Farr, T.G., Moore, A.W. and Watkins, M.M. (2017), Sustained water loss in California’s mountain ranges during severe drought from 2012 to 2015 inferred from GPS, Journal of Geophysical Research: Solid Earth, 122. https://doi.org/10.1002/2017JB014424.
Klein, K., Y. Bock, X. Xu, D. Sandwell, D. Golriz, P. Fang, L. Su (2019), Transient deformation in California from two decades of GPS displacements: Implications for a three-dimensional kinematic reference frame, Journal of Geophysical Research: Solid Earth, 124(11), 12189-12223. https://agupubs.onlinelibrary.wiley.com/doi/full/10.1029/2018JB017201
Liu, Zhen, Danan Dong, and Paul Lundgren (2011), Constraints on time-dependent volcanic source models at Long Valley Caldera from 1996 to 2009 using InSAR and geodetic measurements, Geophysical Journal International, 187: 1283-300.
Rogers, Garry, and Herb Dragert (2003) Episodic tremor and slip on the Cascadia subduction zone: The chatter of silent slip, Science, 300: 1942-43
Zeng, Y., & Shen, Z.‐K. (2017), A fault‐based model for crustal deformation in the western United States based on a combined inversion of GPS and geologic inputs. Bulletin of the Seismological Society of America, 107(6), 2597–2612. https://doi.org/10.1785/0120150362;