


Strain Rate Grids
Strain rate grids (fields/maps) are an important tool for crustal deformation studies. They reflect the buildup of elastic stress in the crust, are indicative of crustal rheology and aid in assessing earthquake hazards. Strain rate grids are independent of a reference frame since in its simplest representation a strain is a velocity between two-points divided by the distance between them. However, there are many ways to construct strain rate grids (UCERF3 2011; Sandwell et al., 2016) related to the interpolation and weighting method, underlying rheological assumptions and fault geometry. Typically, strain rate grids are constructed from steady-state geodetic velocities that are calculated over the interseismic period, wherein transients such as coseismic and postseismic deformation are nuisances and dealt with in various ways, through removal of observations over the affected time interval and/or modeling as we do as part of parametric time series analysis.
In our project, we are also focused on transient motions. We create strain rate grids based on weekly residual displacements relative to an underlying interseismic fault slip model according to the methodology of Klein et al. (2019). Currently, we limit ourselves to the horizontal (2-D grids). We introduce the interseismic fault slip model for the Western U.S. (Zeng & Shen 2017) for better resolution or elastic deformation near faults for California and Nevada. In lieu of a fault-slip model, for Cascadia, we grid our estimated velocities. Figure 25 shows an example of residual displacement maps (vectors), interpolated displacement fields and maximum shear strain and dilatation rates.
A series of files are created every week in parallel with the displacement grids and other weekly products. The files are archived at SOPAC and CDDIS:
SOPAC: http://garner.ucsd.edu/pub/measuresESESES_products/StrainRateGrids/
CDDIS: https://cddis.nasa.gov/archive/GPS_Explorer/archive/strain_rate_grids/V1/
CDDIS landing page: https://cddis.nasa.gov/Data_and_Derived_Products/GNSS/MEaSUREs/gnss_measures_strain_rates_001.html
Tar file: StrainRateGrids_yyyymmdd.tar.gz
Directory structure:
Tables >
ResRate_Zeng_YYYYMMDD.dat
Dilatation_YYYYMMDD.dat
MaxShearRate_YYYYMMDD.dat
SecularModelGrd >
rn_YYYYMMDD.grd -- north component of ResRate_Zeng in grid form
re_YYYYMMDD.grd -- east component of ResRate_Zeng in grid form
StrainRateGrd >
Dilatation_YYYYMMDD.pdf
Dilatation_YYYYMMDD.grd
SecondInvariant_YYYYMMDD.pdf
SecondInvariant_YYYYMMDD.grd
MaxShearRate_YYYYMMDD.pdf
MaxShearRate_YYYYMMDD.grd
RateTS >
WNAM_{YYYYMMDD of input time series}_WeekRateMod_tYYYY.YYYY.dat -- rates extracted from stations at each epoch
Movies (to be available, shortly)>
Dilatation_YYYYMMDD.mp4
MaxShearRate_YYYYMMDD.mp4
SecondInvariant_YYYYMMDD.mp4
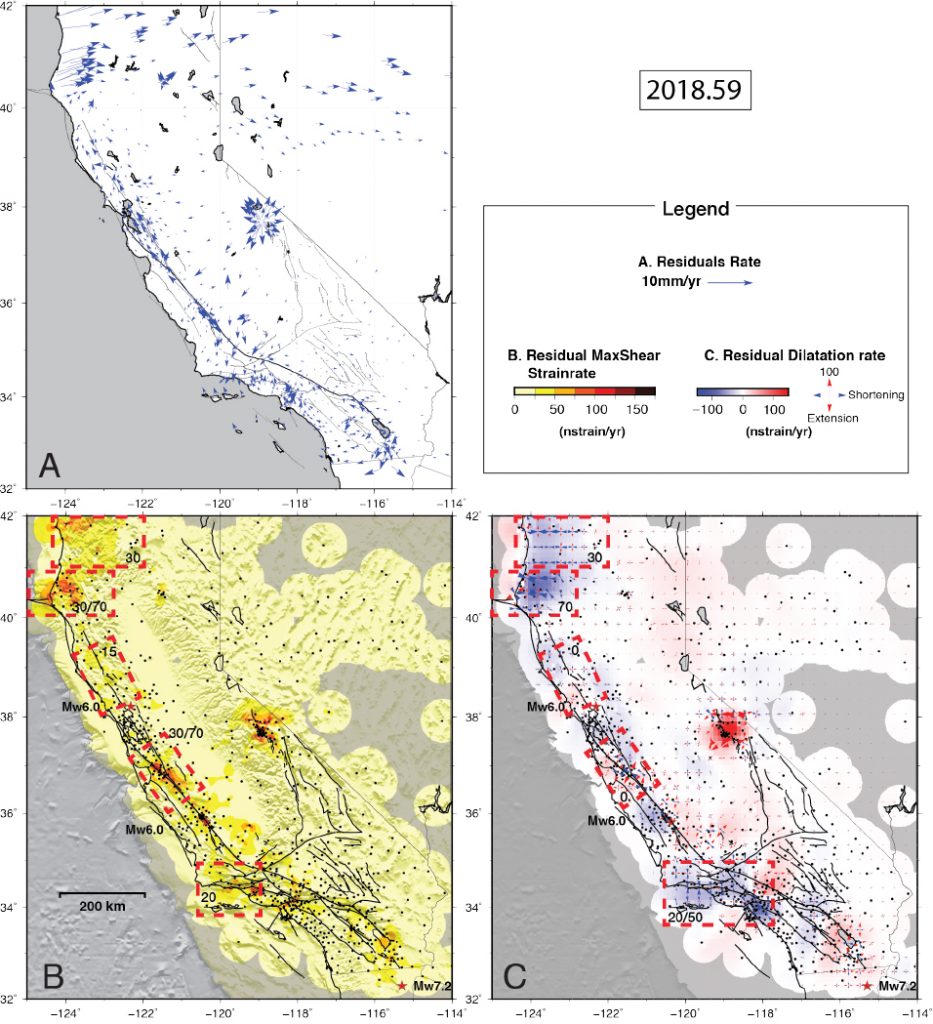
Residual maps and interpolated fields at epoch 2018.59. A) Velocity residual map (observed minus ZS2017-predicted); B) Maximum shear strain rate residual grids; C) Dilatation rate residual grids. Red vectors indicate extension, blue vectors indicate contraction. Areas of interest described are indicated by red dashed boxes including magnitudes. Values of strain rate are indicated for each area highlighted by a red contour. When important variations are observed, the mean and the maximum values (‘mean/max’) are given. For areas where strain rate is homogeneous, only the mean value is indicated. Source: Source: (Klein et al., 2019).