

ITRF2014 Velocities
Station velocities (user: anonymous; password: e-mail address)
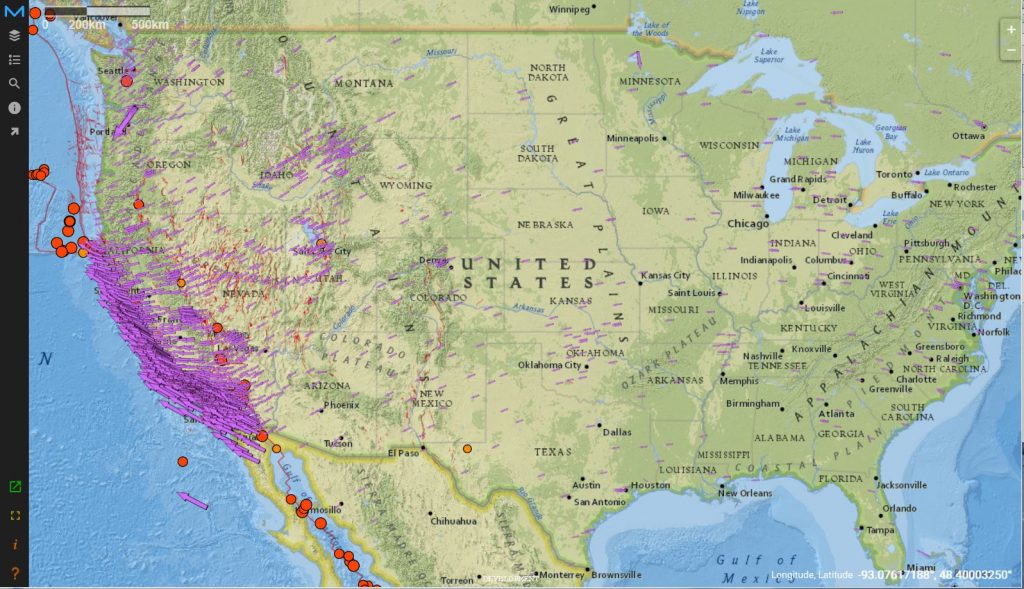
The 3-D station velocity product contains the slopes of the daily displacement time series and their uncertainties (in mm/yr), as recorded in the displacement product headers. Since the time series analysis is performed separately for each component (NEU), the velocities are assumed to be uncorrelated (zero covariances). The velocity uncertainties are scaled according to Williams (2003) to take into account colored noise. A new velocity product is produced weekly, using the unfiltered combined (comb) displacement time series. Only stations with a minimum of 2.5 years of data are included. The header of the text file contains the relevant documentation.
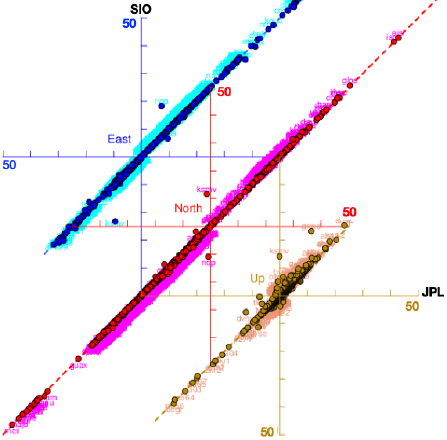
Estimates of the east (blue circles), north (red circles), and up (gold circles) velocity components are compared between JPL (plotted on the horizontal axis) and SIO (plotted on the vertical axis). If the JPL and SIO estimates were identical, then all the circles would plot along a 45° line. We conclude that the JPL and SIO estimates are close for nearly all GPS sites. There are 1690 GPS sites on the plot, all with at least 10 years of data.
References
Bock, Y., Moore, A.W., Argus, D. F., Fang, P., Jiang, S., Kedar, S., Knox, S.A. Liu, Z. & Sullivan A. (2021), Extended Solid Earth Science ESDR System (ES3): Algorithm Theoretical Basis Document: Chapter 4.2 http://sopac-csrc.ucsd.edu/wp-content/uploads/2021/08/ESESES-ATBD.pdf
Williams, S. (2003), The effect of coloured noise on the uncertainties of rates estimated from geodetic time series, Journal of Geodesy 76(9-10): 483-494.