
Troposphere & Integrated Water Vapor - GNSS Meteorology
JPL 5-second ZTD and IWV
(You may need to create a NASA EarthData account)
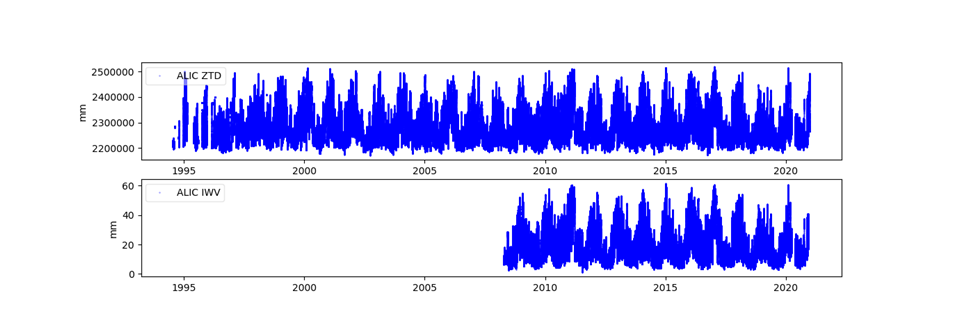
We provide zenith troposphere delays (ZTD) at 5-minute resolution from the GipsyX PPP process in the SINEX_TRO2 format for ~3000 stations from 1992-present, extended weekly with the latest 7 days processed with Final JPL orbits.
We also provide integrated water vapor (IWV) at 5-minute resolution for stations with onsite surface temperature and pressure sensors.
Applications:
Retrospective studies of extreme weather (e.g., North American Monsoon and Atmospheric River events), and correction of tropospheric artifacts in GNSS/InSAR processing for improved surface deformation maps.
1. Southern California summer monsoon
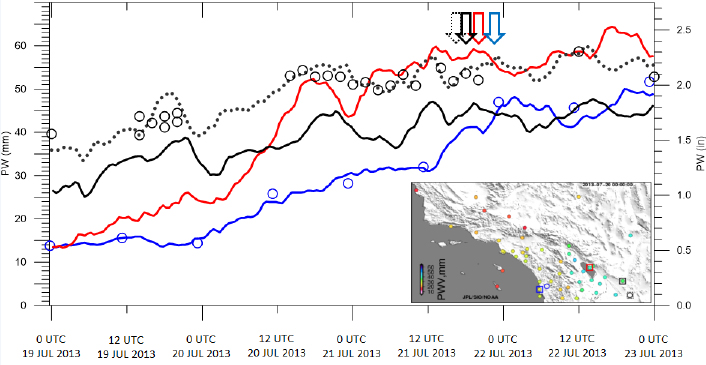
GPS PWV measurements were used both operationally to track a North American Monsoon event and forecast flash flooding. Circles represent PW (cm) for radiosondes at San Diego, California (blue), and Yuma, Arizona (black). Solid traces show GPS PW measurements at San Diego, California (blue), Durmid, California (red), Glamis, California (black), and Yuma, Arizona (dotted black). Arrows indicate the times of passage of an upper low at the identified GPS-Met sites. Map locates GPS stations with squares at San Diego (blue), Durmid (red), Glamis (black), and Yuma (dotted black), and radiosondes with circles at San Diego (blue) and Yuma (black). PW in mm at the GPS stations is shown, according to the color scale, at 1700 PDT 19 Jul (0000 UTC 20 Jul). Source: (Moore et al. 2015).
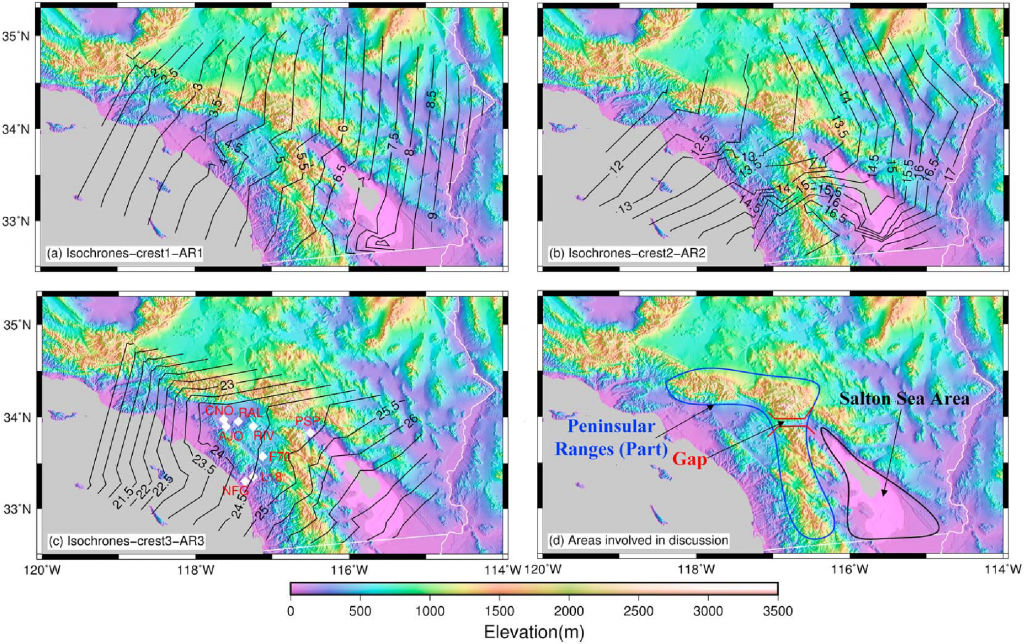
2. Southern California winter atmospheric river sequence
References
Moore, A.W., I. J. Small, S. I. Gutman, Y. Bock, J. L. Dumas, P. Fang, J. S. Haase, M. E. Jackson, J. L. Laber (2015), National Weather Service Forecasters Use GPS Precipitable Water Vapor for Enhanced Situational Awareness during the Southern California Summer Monsoon, Bull. Amer. Meteorol. Soc. (BAMS) 96(11), 1867-1877. https://doi.org/10.1175/BAMS-D-14-00095.1
Wang M., J. Wang, Y. Bock, H. Liang, D. Dong, P. Fang (2019), Dynamic Mapping of the Movement of Landfalling Atmospheric Rivers over Southern California with GPS Data, Geophys. Res. Lett, 46. https://doi.org/10.1029/2018GL081318