
![]()
![]()
Earthquake Early Warning and Rapid Response
SOPAC’s home in Southern California has a history of damaging earthquakes. With the San Andreas Fault, Elsinore Fault, Imperial Fault, and many others, earthquake early warning and rapid response is a major priority in our area. The Rose Canyon Fault, which runs directly adjacent to the Scripps Institution of Oceanography, is capable of producing a large earthquake up to a magnitude 7.
SOPAC is developing a prototype seismogeodetic earthquake early warning system for the western United States to assist in earthquake preparedness and seismic hazard mitigation. The term “earthquake early warning” is a misnomer. Rather than warning in advance of an earthquake, the goal of earthquake early warning is to quickly identify an earthquake, and warn communities further from the earthquake epicenter of impending shaking.
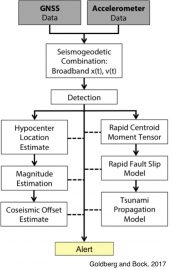
Typically, earthquake early warning systems around the world are designed using traditional seismic instrumentation (broadband velocimeters and strong-motion accelerometers). At present, Global Navigation Satellite System (GNSS) instrumentation (GPS and other satellites) is not included in any active early warning system. However, GPS provides a useful dataset for characterizing large earthquakes, where seismic instrumentation struggles. By using the two instruments in tandem, we have developed a system capable of real-time P-wave detection, determining the epicentral location, and estimating the earthquake magnitude, in addition to higher-order rapid earthquake modeling.
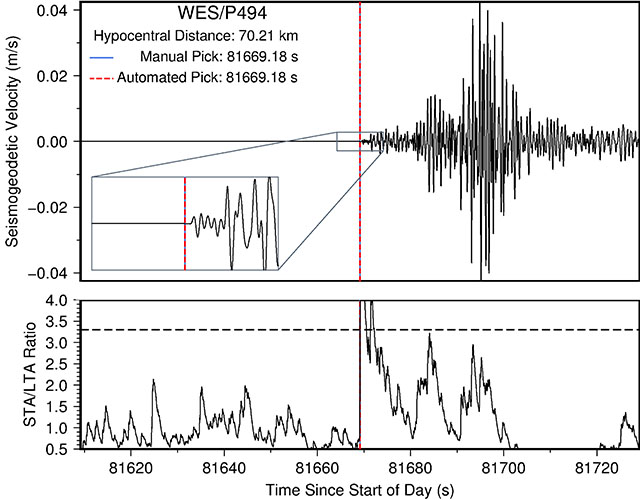
The output of a seismogeodetic analysis is station displacements and seismic velocity waveforms. The earliest seismic wave arrivals, P-waves, are detectable in the velocity waveforms. Once four detections are made within a region, we use the timing of those detections to identify the location of the earthquake. This location is updated with each subsequent detection, creating a more reliable solution with every update. The maximum displacement amplitude is used to estimate the earthquake magnitude, one of the major metrics for determining the likelihood of damage resulting from the earthquake.
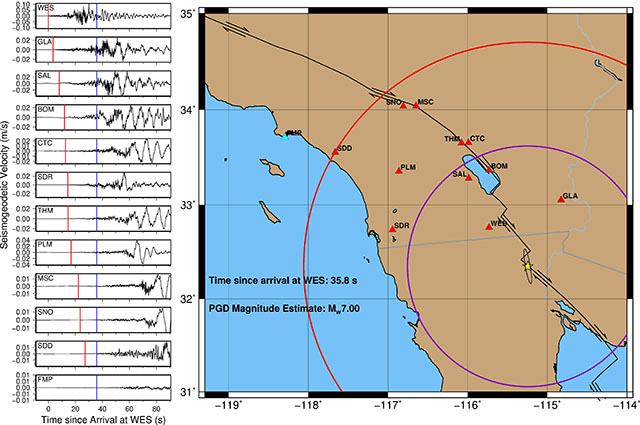
2010 Mw7.2 El Mayor Cucapah Earthquake
On Easter Sunday, 2010, a magnitude 7.2 earthquake struck just south of the United States – Mexico border. The earthquake caused considerable damage in Mexicali, Baja California, Mexico, and broke water mains and caused structural damage 110 miles away in San Diego, California. At the time, there was no earthquake early warning system in place in California. However, this earthquake has become one of the main test events for our prototype system. By replaying the data as if it were being received in real-time, we can see what kind of warning we could have achieved, had our system been running in 2010.
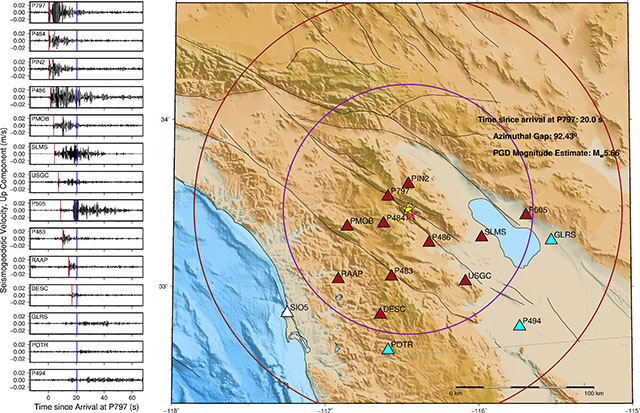
2016 Mw5.2 Borrego Springs Earthquake
On June 10, 2016, a Mw5.2 earthquake struck in the desert east of San Diego. The shaking was felt by some in La Jolla, but for the most part, this earthquake was too small to cause widespread shaking and damage. It occurred directly in the middle of a set of seismogeodetic stations. Had our prototype system been running at the time of this earthquake, the result would have allowed a few seconds of warning before the arrival of shaking in San Diego. Our algorithm locates the earthquake very well, within just a couple km of the final USGS location.
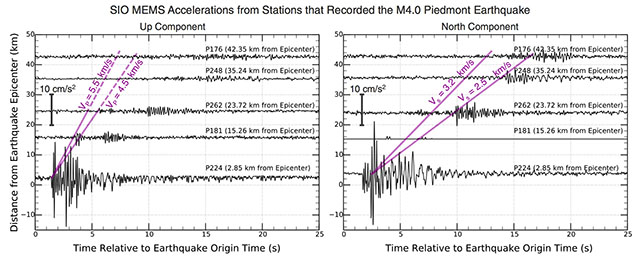
Mw4 earthquakes in southern and northern California
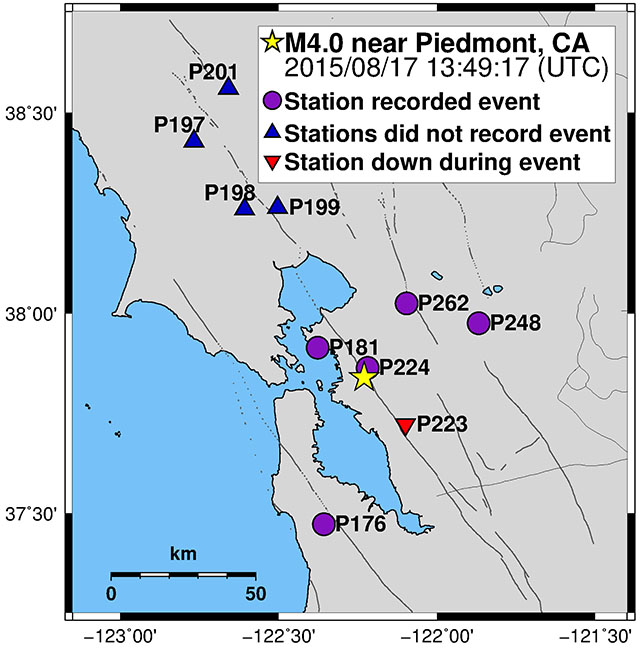
A series of smaller events (~M4) help to delineate the lower limit of earthquake detectability using our SIO GAPs. For example, the 2015 M4 earthquake in Piedmont, CA was observed at five of our SIO GAP stations. The earthquake signal can be seen at 5 stations within 45 km of the epicenter. The P-wave arrival, the first and smallest seismic wave, is visible in the nearest three stations, up to ~24 km from the epicenter. The larger amplitude S-wave, the second seismic arrival, is visible out to ~42 km from the epicenter. Earthquakes of this low magnitude would not be expected to trigger a warning since they are unlikely to cause damage or put human safety at risk. However, these observations provide confidence that our instrumentation is able to adequately detect earthquakes large enough to require an alert.
Network Optimization
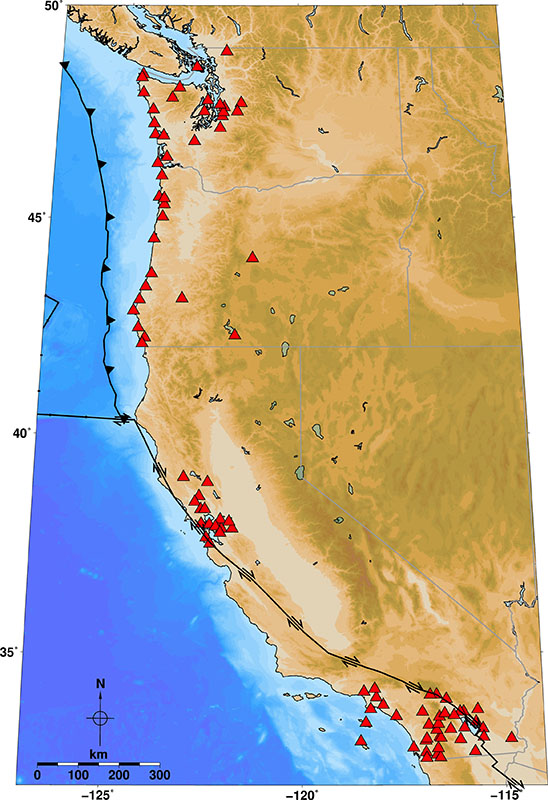
The seismic (broadband seismometer and strong-motion accelerometer) and GPS networks were developed independently from one another. As a result, while the seismic and GNSS networks are each fairly dense in the western United States, the network of collocated seismogeodetic stations (strong-motion accelerometer and GNSS in the same location) is more sparsely distributed. At SOPAC, we are working toward expansion of the seismogeodetic network by economically upgrading existing GNSS stations with an SIO Geodetic Module and a MEMS Accelerometer Package (GAP—link back to seismogeodesy page here).
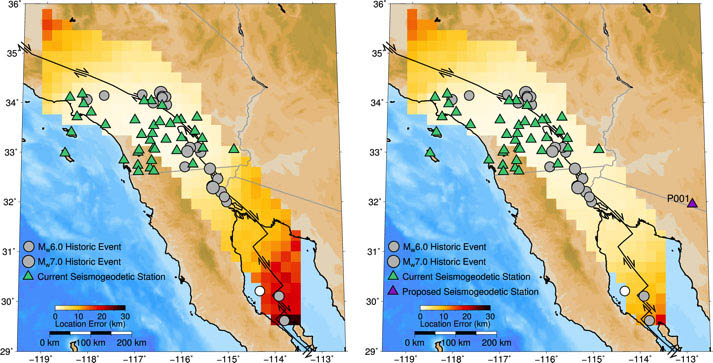
It is difficult to pinpoint the location of an earthquake when it occurs outside of the network (i.e. the epicenter is not fully surrounded by stations). It is therefore important to prioritize station upgrades (from single-instrument to seismogeodetic) at those stations that will have the biggest positive impact on our ability to locate and characterize earthquakes.
In Southern California, our station coverage is good enough to identify the locations of earthquakes within the network. But, the major fault systems extend south past the U.S.-Mexico border, where we currently cannot get real-time seismogeodetic data. Therefore, our ability to rapidly locate earthquakes in this region is limited. By upgrading a single existing GNSS station in southern Arizona (station P001) with an SIO GAP, we have been able to improve the reliability of our earthquake location method in this region.
References
Bock, Y., D. Melgar, B. W. Crowell (2011), Real-Time Strong-Motion Broadband Displacements from Collocated GPS and Accelerometers, Bull. Seismol. Soc. Am., 101, 2904-2925, doi: 10.1785/0120110007.
Goldberg, D. E., Y. Bock (2017), Self-contained local broadband seismogeodetic early warning system: Detection and location, J. Geophys. Res. Solid Earth, 122,4, 3197-3220, doi:10.1002/2016JB013766.
Saunders, J. K., D. E. Goldberg, J. S. Haase, D. G. Offield, Y. Bock, D. Melgar, J. Restrepo, R. B. Fleischman, A. Nema, J. Geng, C. Walls, D. Mann, G. Mattioli (2016), Seismogeodesy using GNSS and low-cost MEMS accelerometers: perspectives for earthquake early warning and rapid response, Bull. Seismol. Soc. Am.,106, 6, 2469–2489, doi: 10.1785/0120160062.