

![]()
![]()
Structural Monitoring
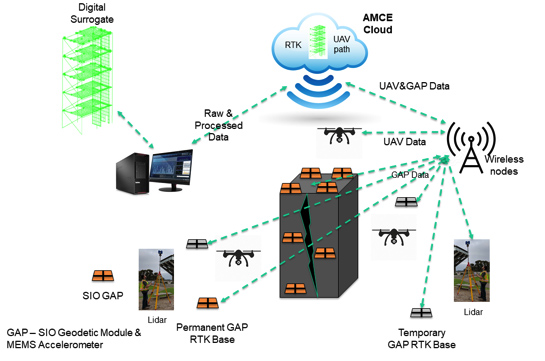
Major earthquake events represent a significant threat to the Nation’s public safety, infrastructure and economy. The 1994 Mw6.7 Northridge earthquake, for example, caused 57 fatalities, more than 8700 injuries, and up to $44 billion in damage to property and critical infrastructure. SOPAC has applied its work in seismogeodesy and earthquake early warning to structural health monitoring (SHM) of important engineered structures (e.g., buildings, dams, bridges). We are studying methods for short-term scenarios, such as rapid response to an earthquake or other natural disaster, and long-term tracking of the health of a structure to save lives and minimize collateral damage. We are also integrating seismogeodetic data with UAV and LIDAR imagery. Our work is in collaboration with colleagues at UC San Diego’s Jacobs School of Engineering’s Structural Engineering Department, Qualcomm Institute and Planning, Design and Construction.
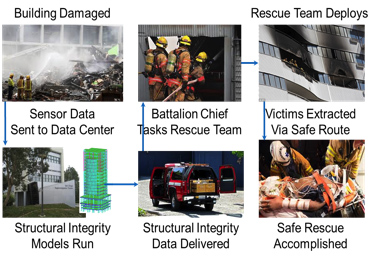
The primary research and development goal is to provide digital surrogates for engineered structures of significance to assist emergency responders during a natural hazard that may have compromised structural integrity, possibly endangering residents and rescuers. If any fatigue begins to demonstrate a behavior or indication that the structure has passed a safety risk threshold, engineers would receive an alert to that effect so city decision makers, insurance companies, building owners, and residents could understand the situation that was unfolding. The data would also be fed to emergency responders so they could take appropriate action including safety inspections and validation of the sensor data that caused the threshold to be crossed. Immediate and accurate assessment of the health-state of civil infrastructure following an earthquake and their secondary disasters, such as fire, is key in decision-making enabling first responders and decision makers to channel resources in a way that maximizes public safety and minimizes economic loss. Today, without accurate, validated, and credible technical decision support data, first responder leaders use knowledge of building construction techniques and visual observations to make their best judgments before deploying search and rescue teams. This step may include structural bracing before rescue teams are the deployed. The teams can then safely locate and retrieve victims from that area and transport them to emergency medical sites for treatment. This is followed by on-site visual inspections to assess damage and tag the buildings, accordingly. Such inspections may lack the precision required to detect subtle damage that can compromise the stability of a structure, particularly in an aftershock.
UC San Diego Geisel Library Project
A recent study indicates there is risk of up to a magnitude 7.2 earthquake from offshore faults running from San Diego northward (Sahakian et al., 2016) and a magnitude ~7.9 along the southern San Andreas fault. To this end, we have an ongoing SHM project to monitor the Geisel Library on campus in the event of significant seismic shaking with the cooperation of UC San Diego’s Planning, Design and Construction Services and library administrators, in collaboration with the Qualcomm Institute (Falko Kuester, PI) and Structural Engineering Department (Joel Conte, Jose Restrepo and Michael Todd). The project was featured in UC San Diego News.
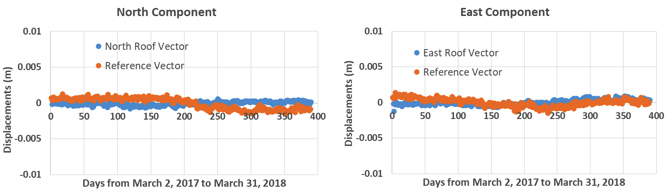
To support this campus activity, we instrumented the Geisel Library with SIO’s GAPs instruments (integrated GNSS/GPS + MEMS accelerometers) with three GAPs on the roof, one in the basement, and one at the Biological Field Station on campus as a reference station, using Topcon TPS Net-G3A receivers and chokering antennas. The GPS data are sampled at 1 Hz and the accelerometer at 100 Hz, transmitted to SOPAC through the university’s internet and processed in real time with the Geodetics RTD software. The first measurements were taken on March 2, 2017 and have run continuously since then.
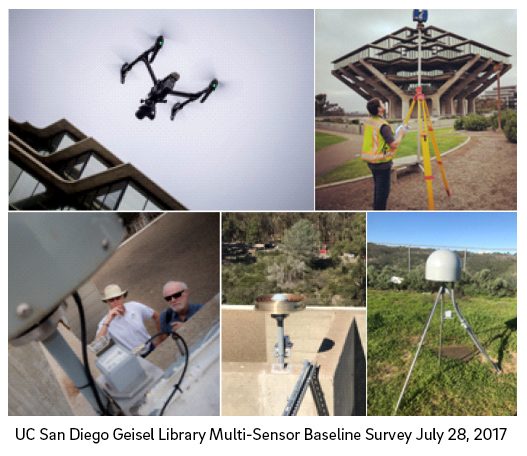
On July 28, 2017 we imaged the library with a ground-based LIDAR and an unmanned aerial vehicle (UAV) to provide, through integration with GPS, a precise (cm-level) high-resolution geometric model and a baseline image for comparison after a future event, such as a significant earthquake. In addition, the LIDAR images were georeferenced using a ground survey with a GPS, total station and level and tied to the reference station and other CRTN stations in the vicinity. Any permanent displacements estimated from a comparison of the post-event and pre-event models will be analyzed to assess structural damage as a basis for the sequence of first responses, up to tagging of buildings. Furthermore, the seismogeodetic data during shaking will provide an estimate of maximum coseismic displacements to assess damage and estimate the building’s frequency’s response.
We repeated the survey on July 23, 2018 with the following changes:
- Set four checkerboard targets on library base and four on library roof. To estimate the coordinates of the targets, we performed a conventional survey at the base and a GNSS rapid static survey on the roof.
- The three permanent GPS roof antennas were temporarily marked with black tape in the shape of an X. We found that there was several cms errors in identifying the X in the UAV imagery
- Flew GNSS-aided UAV imagery to estimate the 3-D UAV trajectories with respect to the off-library reference station (LBRF). However, the precision was on the order of ~meter and not useful.
We repeated the 2018 survey on September 6, 2019 with the following changes:
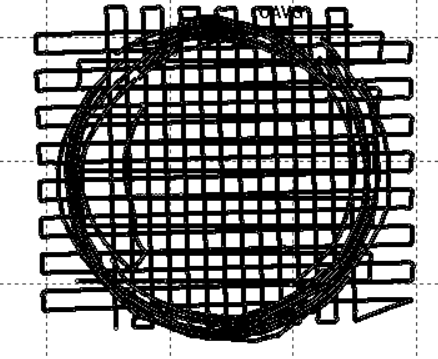
- Flew GNSS RTK-aided UAV (trajectory with centimeter-level precision - see top view in figure below) while connecting to the library base station (LBRF) sampling at 1 Hz. We used a Phantom 4 RTK drone. In post-processing we recomputed the trajectory used PBO station P472 as reference, sampling at 5 Hz.
- Improved the markings on the three roof-top GNSS antenna radomes using a circular white stick-on marker (less <1 cm diameter) surrounded by 3/4" electrical tape.
Initial results indicate the precision of the multi-sensor-derived point clouds are accurate at the cm level. Note that the surveys and imagery were conducted in the CSRC Epoch 2017.5 NAD83 reference frame using SECTOR coordinates on July 28, 2017 (the date of the first survey), for all three years.
Mexicali Project
The Mexicali project is an ongoing SOPAC project in collaboration with colleagues at UC San Diego’s Structural Engineering Department (José Restrepo, PI). We installed three SIO GAP seismogeodetic systems with Topcon TPS Net-G3A receivers and chokering antennas on the roof of a three-story parking structure in Mexicali, Mexico, and at a nearby reference station. We also installed an SIO GAP accelerometer in the basement of the parking structure. The first measurements were collected on December 4, 2015. The data are sampled at 10 Hz for the GPS and 100 Hz for the accelerometers and transmitted to the SOPAC facility through the Internet.
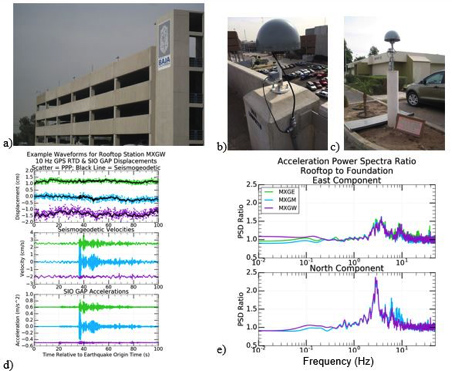
This area was chosen since it lies in a seismically active zone, the Imperial Valley at the southern end of the San Andreas fault (Lyons et al., 2002) with a series of faults extending south into northeastern Baja California, Mexico, near the epicenter of the Mw7.2 2010 El Mayor-Cucapah earthquake that displaced GPS stations throughout southern California. Our system captured the Mw 5.2 Borrego Springs earthquake that occurred on the San Jacinto Coyote Creek fault, 126 km northwest of the parking structure, and documented the amplification of the east and north component of ground motion. The displacement measurements detected no discernable permanent deformation above the accuracy limit of ~ 1.5 cm.
Shake table experiments
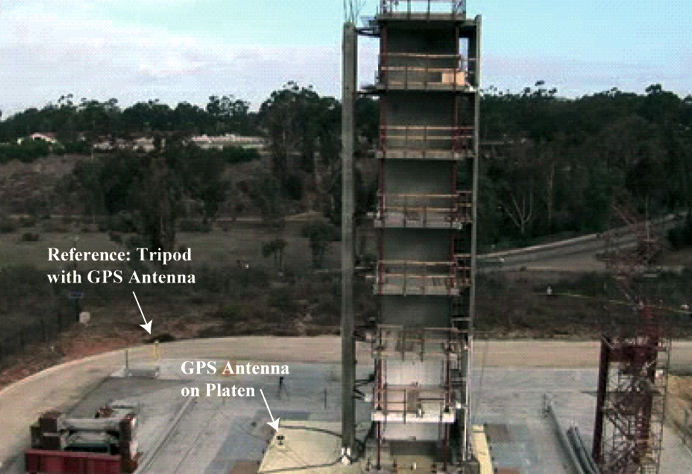
We have conducted a series of tests over the last decade at UC San Diego’s Large High Performance Outdoor Shake Table (LHPOST), the largest such facility in the U.S. The LHPOST includes a 12.2 m × 7.6 m steel table platform (platen) with a reinforced concrete reaction mass, two servocontrolled dynamic actuators with large servo-valves, a platen sliding system with hydrostatic pressure balance bearings, and a real-time multivariable MTS 469DU digital controller with an output of 1024 Hz in displacement. The system is uniaxial and oriented east–west. It can achieve maximum peak to-peak displacement of 0.75 m, velocity of 1.8 m/s, and acceleration of 3 g, with a frequency bandwidth of 0–20 Hz. LHPOST will be upgraded to triaxial mechanism by 2021.
2006-2007: Seismogeodetic experiments on a full-scale seven-story reinforced concrete wall building
A series of earthquake simulations were conducted in 2006–2007 by UC San Diego’s Structural Engineering Department (José Restrepo, PI) to study the response of a full-scale seven-story reinforced concrete wall building. It was subjected to four low- to high-intensity ground motions, as recorded by accelerometers during the 1971 Mw 6.6 San Fernando and 1994 Mw 6.7 Northridge earthquakes (Moaveniet al., 2010). The objective of this research was to verify the seismic response of reinforced concrete wall systems designed for lateral forces associated with a displacement-based design methodology. The building with a total height of 19.2 m and total weight of 250 metric tons was constructed on the shake table platen. We took the opportunity to successfully test our seismogeodetic Kalman filter algorithms to optimally combine GPS displacement and accelerometer data by comparing the seismogeodetic displacements and velocities with the input strong motion accelerations. Seven 50 Hz Navcom NCT-200DGPS instruments were deployed with three receivers mounted on the roof, two cantilevered on the third and fifth floors of the flange wall, one receiver located just off the shake table’s platen as a stable reference point, and the seventh receiver on the platen. The GPS antennas were collocated with MEMS-Piezoresistive MSI model 3140 accelerometers sampling at 240 Hz.
See Bock et al. (2011) for the results of these experiments and a movie (below) of one of the experiments. The data were archived as explained in Melgar et al. (2013).
2012 Full-Scale Structural and Nonstructural Building System Performance during Earthquakes & Post-Earthquake Fire
To date, only a handful of full-scale building experiments have been conducted. Of these, none have evaluated the post-earthquake fire performance of the complete building system and only in Japan have they emphasized evaluating nonstructural component and system (NCS) response during earthquake shaking. This belies the fact that NCSs encompass more than 80% of the total investment in building construction. Furthermore, over the past three decades the majority of earthquake-induced direct losses in buildings are directly attributed to NCS damage.
This shaketable project (Jose Restrepo, PI) involved earthquake and post-earthquake fire testing of a five-story building built at full-scale and completely furnished with NCSs, including a functioning passenger elevator, partition walls, cladding and glazing systems, piping, HVAC, ceiling, sprinklers, building contents, as well as passive and active fire systems. In support of this project, SOPAC instrumented the building with 50 Hz Navcom NCT-200DGPS instruments. Results of these experiments can be found in Chen et al. (2017). See movie below.
2013: SIO MEMS accelerometer experiments on a partially precast-concrete four-story structure constructed at half scale
The objective of this research project was to advance knowledge toward the development of innovative floor anchorage systems that reduce inertial forces during earthquakes and maintain a centered floor afterward (Robert Fleischman, PI). We leveraged this project to compare the low-cost SIO GAPs MEMS accelerometers to observatory-grade accelerometers. We showed that the two types of accelerometers agree in the frequency ranges of seismological and engineering interest and produce equivalent seismogeodetic estimates of displacement and velocity (Saunders et al., 2016). In light of the successful tests we deployed, with UNAVCO, 27 SIO MEMS packages at GPS monitoring stations in southern California and the San Francisco Bay area and have recorded five earthquakes (M4.5, M 4.2, M 4.1, and two of M 4.0).
The earthquake tests were based on strong-motion recordings from previous events. A recording from the 1979 Mw 6.6 Imperial Valley earthquake (peak ground acceleration [PGA] 0.59g), was used to represent the design basis earthquake (DBE) appropriate for seismic hazard in Seattle, Washington. Similarly, a recording of the 1989 Mw 6.9 Loma Prieta earthquake (PGA 0.41g) was used to represent the DBE in Berkeley, California (Fleischman et al., 2015). Topcon NET-G3A GPS receivers were installed at six locations on the building with collocated SIO MEMS accelerometers: at the four corners of the roof, the roof center, and the northwest corner of the foundation. Observatory-grade Kinemetrics EpiSensor accelerometers were collocated with MEMS accelerometers in three locations, on the roof, at the end of the foundation extension beam, and the third on the foundation adjacent to the base of the extension beam. A GPS reference station was placed 70 m west of the shake table platen. See movie below.
2016 Earthquake and Post-Earthquake Fire Performance of Mid-Rise Light-Gauge Cold-Formed Steel Framed Buildings
This project evaluated the earthquake and post-earthquake fire performance of mid-rise light-gauge cold-formed steel (CFS) and sheathed building systems through full-scale earthquake and live thermal testing of a 6-story wall-braced system (Tara Hutchinson, PI). Light-gauge cold-formed steel (CFS) framed multi-story residential housing has the potential to support societies urgent need for low cost, efficient, multi-hazard resilient (e.g., fires) housing.
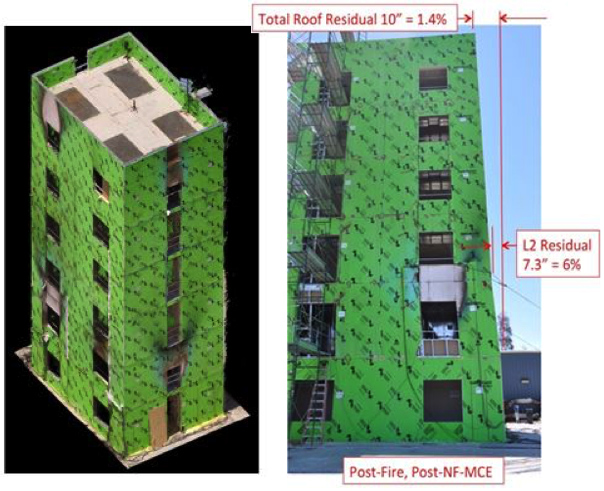
This experiment provided a unique opportunity to use GPS and UAV technology in tandem. The test building was subjected to a range of increasing intensity earthquake motions, and subsequently subjected to live compartment fires, mimicking a fire-following-earthquake (FFE) scenario. The GPS provided real-time (within seconds) direct measurements of the complete motion of a platform (translations/displacements and rotations) with millimeter and 0.01° precision (Geng et al., 2013), respectively. Throughout the earthquake and fire tests, UAV-based imaging was conducted with particular focus on exterior system performance (walls, windows). The UAV data were then used for the creation of high-resolution image mosaics documenting pre-event and post-event conditions, as well as the creation of a preliminary 3D model. The experiment demonstrated the value of UAV imaging techniques, yet also illuminated that the proposed combination with SOPAC technology could be used to georeference images with respect to an external reference frame and bracket the level of precision of the derived models.
The GPS deployment on the structure is fully described in a 2016 SOPAC report and the experiment was documented with Videos.
2018 Multi-Sensor Structural Monitoring of Shear-Dominated Reinforced Masonry Wall Systems
It is critical for structural engineers to understand how strong seismic forces affect the probability of collapse in steel and masonry wall system design. This project conducted from October 29 to December 20, 2018 at LHPOST, was designed to test the seismic resilience of reinforced masonry wall structures (Tara Hutchinson, PI). The project involved dynamic seismic tests and monotonic pull tests on two shear wall structures atop the shake table platen, to evaluate their resilience under intense shear (Figure 1). During the monotonic pull tests, the structure was pulled towards one direction and then released while letting the platen move freely. This was an excellent test of significant coseismic deformation. During the dynamic shaking tests (an earthquake simulation) the platen was forced to move in both directions (LHPOST is uniaxial aligned east-west), with up to 0.75 meters of displacements (Figure 2).
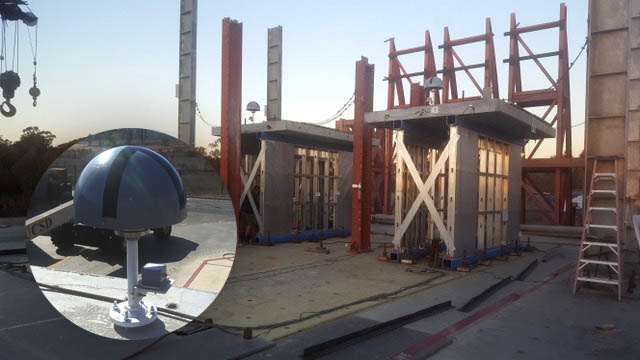
In the absence of an earthquake or other natural hazard at the UCSD Geisel Library, a focus of another project, these experiments provided the opportunity to test our multi-sensor structural monitoring systems under seismic hazard conditions. Each structure, and the shake table platen itself, was instrumented with a seismogeodetic SIO Geodetic Module and SIO MEMS accelerometer package (Figure 1).
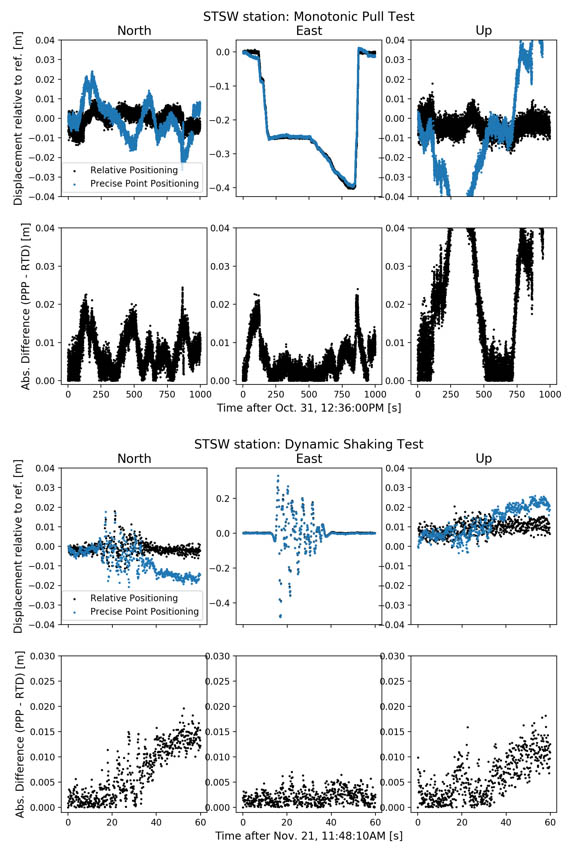
The GPS data was processed in real time at a 10 Hz sampling rate using both relative positioning and precise point positioning (PPP) (Bock and Melgar, 2017), as a test of our real-time analysis capabilities and the accuracy of our displacement solutions. Relative positioning was performed at 10 Hz with respect to a nearby reference station (PBO station P472). PPP was performed with our in-house software derived from the PANDA software (Geng et al., 2016). It is used in support of our local tsunami warning project. Although as expected, relative positioning was more precise with a lower RMS, PPP worked well with an RMS of about 0.04 meters during motion (Figure 2).
Simultaneous UAV surveys allow us to evaluate the utility of the proposed multi-sensor analyses and to develop capabilities to merge complementary datasets in a timely manner for use in a hazard response scenario.
References
Bock, Y., D. Melgar, B. W. Crowell (2011), Real-Time Strong-Motion Broadband Displacements from Collocated GPS and Accelerometers, Bull. Seismol. Soc. Am., 101, 2904-2925, doi: 10.1785/0120110007.
Chen, M. C., R. Astroza, J. I. Restrepo, J. P. Conte, T. Hutchinson, and Y. Bock (2017), Predominant period and equivalent viscous damping ratio identification for a full-scale building shake table test. Earthquake Engng. Struct. Dyn., 46: 2459–2477. doi: 10.1002/eqe.2913.
Fleischman, R., J. Restrepo, A. Nema, D. Zhang, U. Shakya, Z. Zhang, R. Sause, G. Tsampras, and G. Monti (2015). Inertial force-limiting anchorage system for seismic resistant building structures, Proc., ASCE Structures Congress, Portland, Oregon, 23-25 April 2015.Geng, J., D. Melgar, Y. Bock, E. Pantoli, and J. Restrepo (2013), Recovering coseismic point ground tilts from collocated high-rate GPS and accelerometers, Geophys. Res. Lett., 40. doi:10.1002/grl.51001.
Lyons, S., Y. Bock, and D. T. Sandwell (2002), Creep along the Imperial Fault, southern California, from GPS measurements, J. Geophys. Res., 107(B10), 2249, doi: 10.1029/2001JB000763.
Melgar, D., E. Pantoli, J. Restrepo, Y. Bock (2013), Displacement Acquisition for the NEESR: BNCS Building Shaketable Test via GPS Sensors, Network for Earthquake Engineering Simulation (distributor), Dataset, DOI:10.4231/D3V97ZR5H. https://www.designsafe-ci.org/data/browser/public/nees.public//NEES-2013-1181.groups
Moaveni, B., X. He, J. P. Conte, J. I. Restrepo, and M. Panagiotou (2010), System identification study of a 7-story full-scale building slice tested on the UCSD-NEES shake table, J. Struct. Eng. 137, doi 10.1061/(ASCE)ST.1943-541X.0000300.
Saunders, J. K., D. E. Goldberg, J. S. Haase, D. G. Offield, Y. Bock, D. Melgar, J. Restrepo, R. B. Fleischman, A. Nema, J. Geng, C. Walls, D. Mann, G. Mattioli (2016), Seismogeodesy using GNSS and low-cost MEMS accelerometers: perspectives for earthquake early warning and rapid response, Bull. Seismol. Soc. Am., 106, 6, 2469–2489, doi: 10.1785/0120160062.
Sahakian V, Kell A, Harding A, Driscoll N, Kent G. (2016), Geophysical evidence for a San Andreas subparallel transtensional fault along the northeastern shore of the Salton Sea, Bulletin of the Seismological Society of America, 106(5), 1963-78. http://dx.doi.org/10.1785/0120150350
Wang, C.E. Wittich, T. C. Hutchinson, F. Kuester, Y. Bock, D. Goldberg, E. Lo (2019), Methodology and Validation of a UAV-Based Video Analysis Approach for Tracking Earthquake-Induced Displacements of Buildings, ASCE Journal of Computing in Civil Engineering, in review.