

![]()
![]()
![]()
Near Ridgecrest Earthquake Sequence July 4-6, 2019
Two earthquakes occurred on the Naval Air Weapons Station China Lake facility near the town of Ridgecrest and Searles Valley.
- July 4, 2019 17:33:48 UTC; Mw6.4; Depth = 10.7 km; Epicenter: 35.705°N, 117.508°W
- July 6, 2019 3:19:52 UTC; Mw7.1; Depth = 8.0 km; Epicenter: 35.766°N, 117.605°W
SOPAC computed coseismic offsets (corrected 11/4/2019) for the two events using the GAMIT/GLOBK software with 30 s data from 98 continuous GNSS stations that experienced a total displacement of 3 mm or greater.
- July 4, 0:00 - 17:00 UTC (processed 2040 epochs)
- July 6, 04:00 - 24:00 UTC (processed 2400 epochs)
- Coseismic offsets for the Mw6.4 event (see Figure 1)
- Coseismic offsets for the M7.1 event relative to the positions after the Mw6.4 event (see Figure 2)
- Total displacements for the two events (see Figure 3)
High-rate (1 Hz) GNSS data collected by the Network of the Americas (NOTA) were made available by UNAVCO. We analyzed the data using precise point positioning displacements, with accelerometer data providing pick P-wave arrivals, to create displacement waveforms (see Figure 4), including stations P595 (see Figure 5) and CCCC (see Figure 6) close to the epicentral region. As an example, 5 Hz displacement waveforms are shown for stations P595 and CCCC nearest to the epicentral region. As a point of local interest, San Diego experienced about 2 cm peak to peak displacement in the east to west direction (see Figure 7). SOPAC is now analyzing the high-rate (5Hz) GNSS buffered data provided by UNAVCO, as well as 100 Hz seismic data from the California Integrated Seismic Network (CISN).

Figure 1: Coseismic displacements for the Mw6.4 earthquake on July 4, 2019.
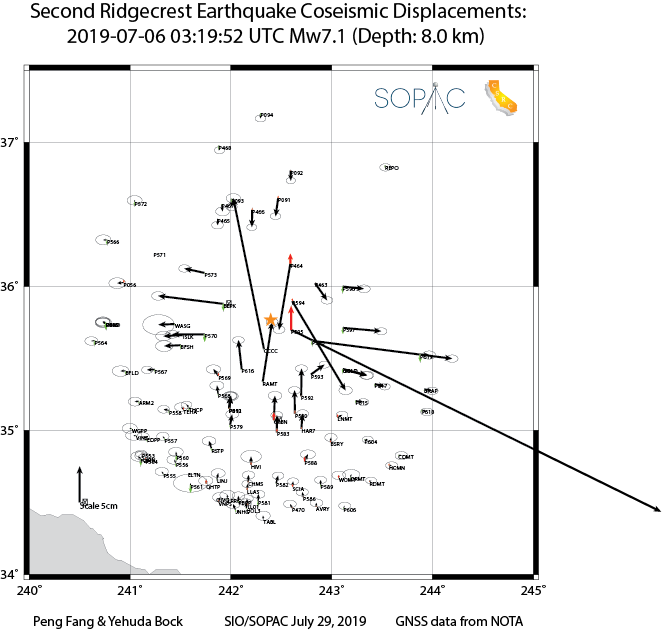
Figure 2: Coseismic displacements for the Mw7.1 earthquake on July 6, 2019.
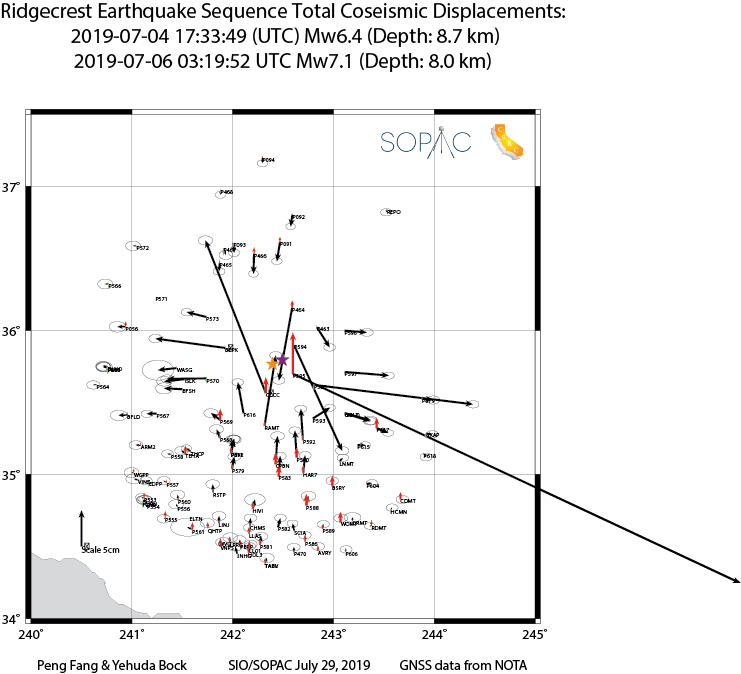
Figure 3: Total coseismic displacements for the Mw6.4 and Mw7.1 earthquakes on July 4, 2019.
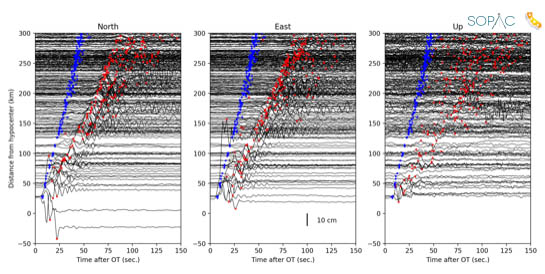
Figure 4: 1 Hz displacement waveforms as a function of distance from the July 6, 2019 Mw7.1 earthquake’s hypocenter. The blue dots represent P-wave arrivals. The red dots denote peak ground displacements.
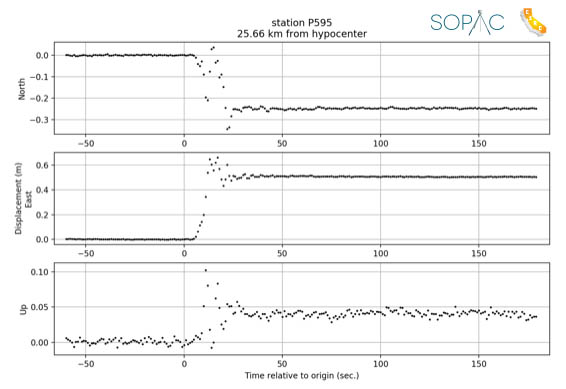
Figure 5: 1 Hz displacement waveforms for GNSS station P595 for the Mw7.1 earthquake on July 6, 2019 (25.7 km from the hypocenter).
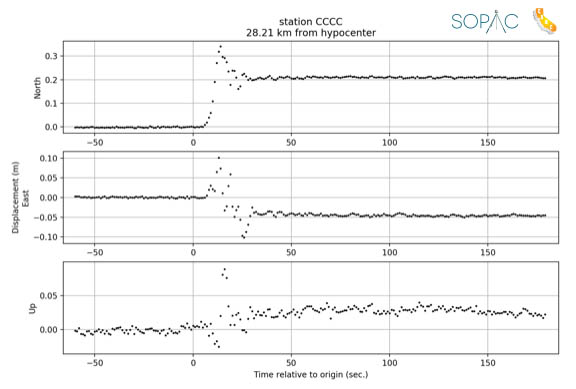
Figure 6: 1 Hz displacement waveforms for GNSS station CCCC for the Mw7.1 earthquake on July 6, 2019 (28.21 km) from the hypocenter).
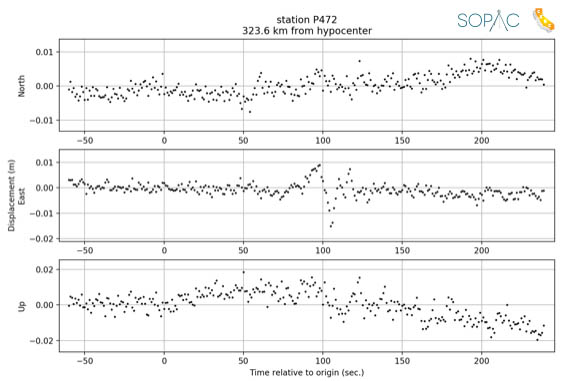
Figure 7: 1 Hz displacement waveforms for GNSS station P472 in San Diego for the Mw7.1 earthquake on July 6, 2019 (323.6 km) from the hypocenter).